Interactive Reports
Key benefits
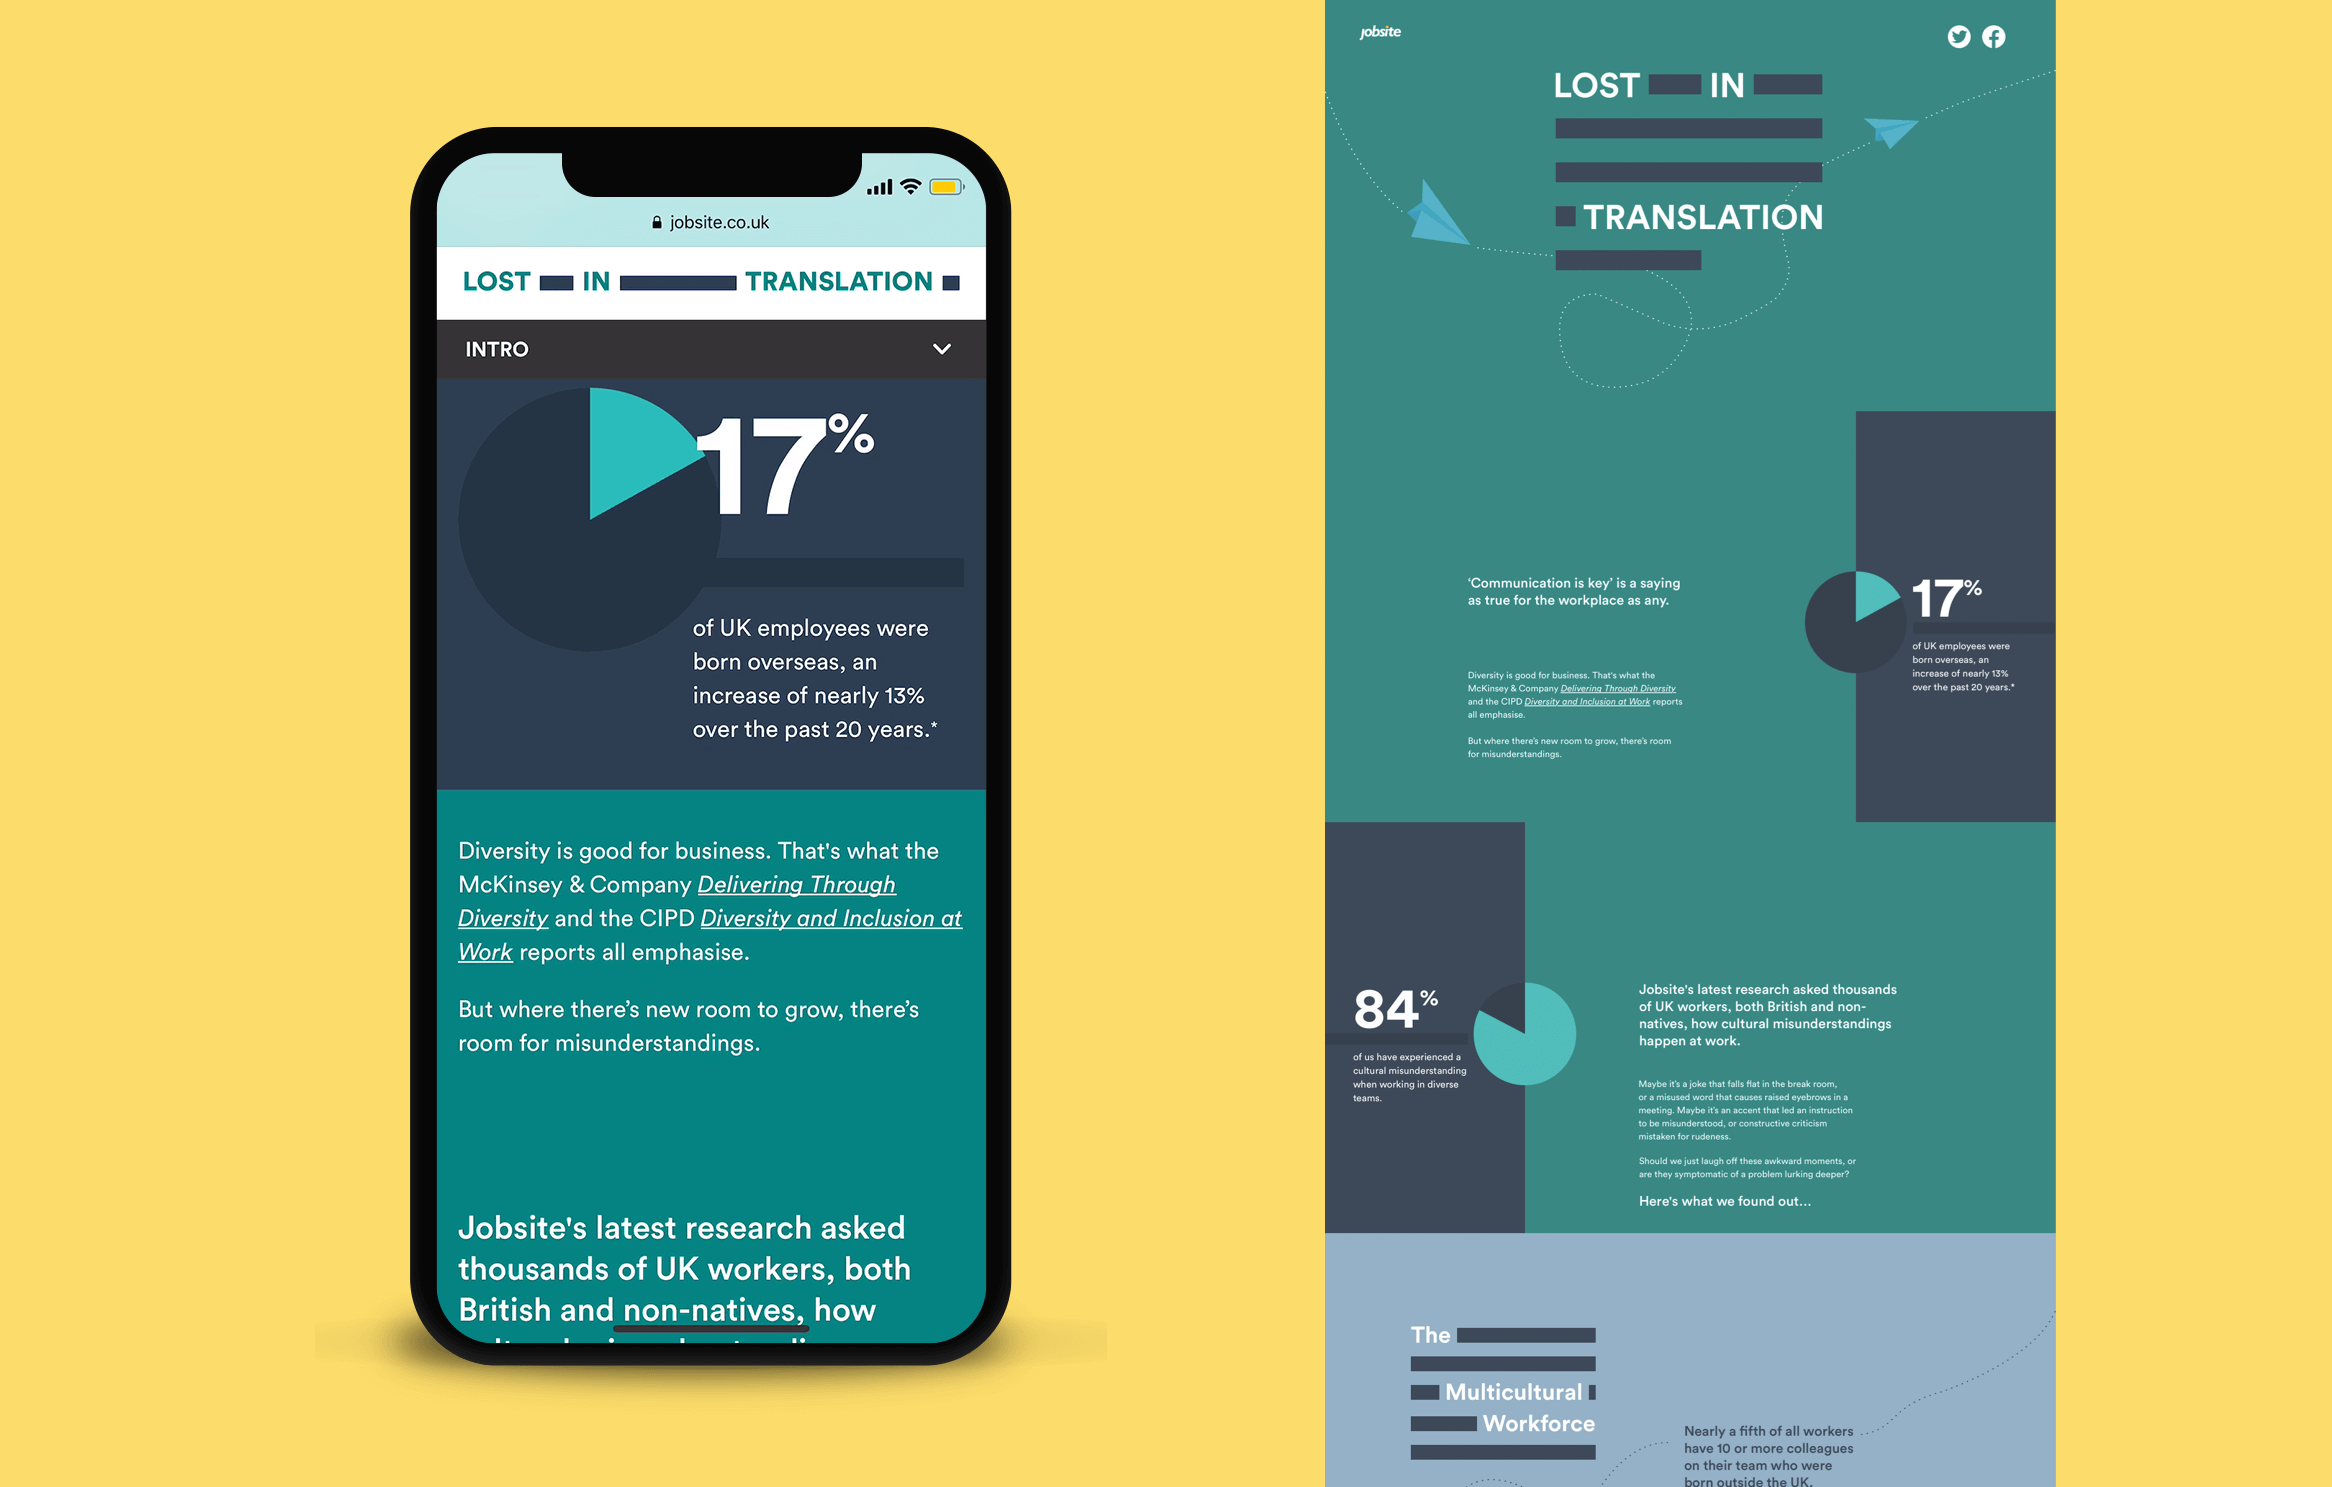
Jobsite | Lost in Translation
Case study
Chronos Sustainability | Business Benchmark Farm Animal Welfare
Case studyFAQ
An interactive data visualisation report engages the user with creative data storytelling. Users can explore large and complex datasets. These reports are usually microsites which are easily accessible through an internet browser. Users can click on various parts of the report to see different visualisations and insights.
Interactive reports provide explanatory data visualisation analysis. They guide users through a well crafted story so they don’t get lost or overwhelmed by the data.
Examples of interactive data visualisation reports are Jobsite – Lost in Translation (https://dev.infogr8.com/our-work/jobsite-lost-in-translation/), Reed State of Skills (https://dev.infogr8.com/our-work/reed-global-strategic-content-partner/), and London’s Brightest Businesses(https://dev.infogr8.com/our-work/workspace-londons-brightest-businesses/).