Intelligence Platforms
Key benefits

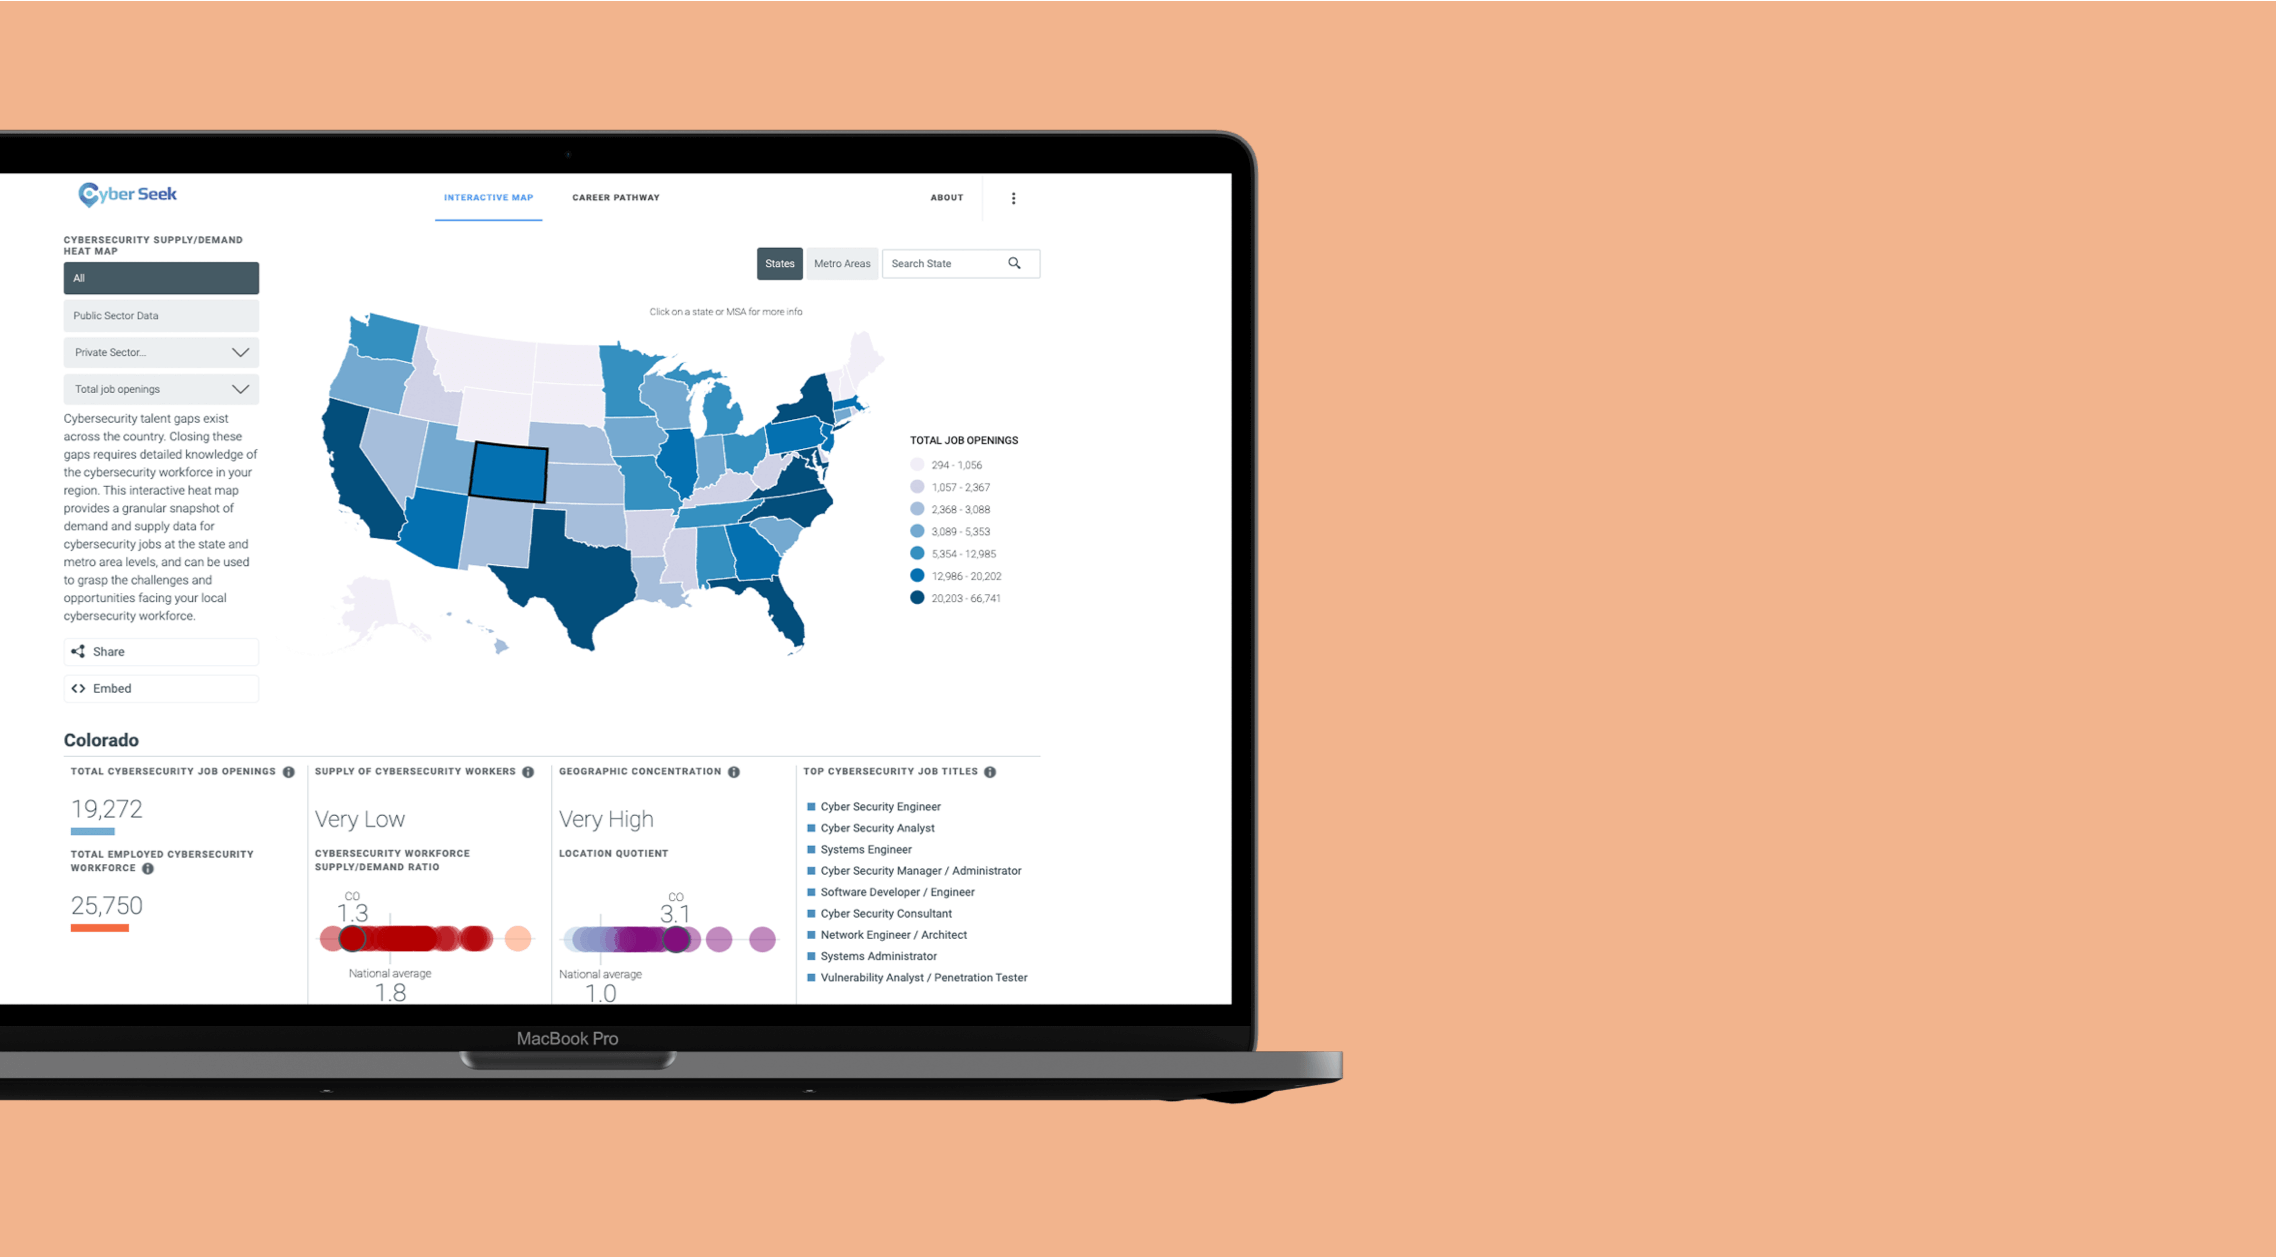
Lightcast | CyberSeek
Case study
Harvard Kennedy School | Workforce Almanac
Case studyFAQ
A data dashboard is commonly used as a business tool to display, analyse, and track data. In contrast to interactive data visualisation reports, data dashboards provide exploratory analysis. Data dashboards can accommodate large datasets and automatically generate charts. You may have used a data dashboard if you track your finances with an app. At a glance, you can see your income, expenses at a large scale, and also detailed information such as the transactions you’ve made recently. A powerful feature of data dashboards is that you can quickly filter data to show what you’re interested in so you can derive new insights.
Data dashboards can be designed using tools such as Tableau or Power BI. If you’re a bit more tech savvy, you can design custom data dashboards with frontend development programming (HTML, CSS, and javascript).
Examples of data dashboards are Cyberseek Burning Glass (https://dev.infogr8.com/our-work/cyberseek-cybersecurity-platform/), Business Benchmark on Farm Animal Welfare (https://dev.infogr8.com/our-work/bbfaw-business-benchmark-report/), and Virgin Media WiFi portal (https://dev.infogr8.com/our-work/virgin-media-wifi-portal/).